1. Introduction
The Adtelligence Platform leverages artificial intelligence and all available customer data like transaction data and CRM data to get a holistic view of your customers and provide them with the exact offer that suits them at the right time. Seamless customer experiences with satisfied customers in an ongoing dialogue ensures a continuous increase in sales.
The Adtelligence platform offers state-of-the-art machine learning models out of the box for all use cases along the customer lifecycle. You only have to configure them, not program them. You don’t need any data science knowledge, Adtelligence has integrated the autopilot and was awarded the AI Champions Award by the state of Baden-Württemberg for this. You can learn more about the simple and intuitive implementation of the platform in this manual.
2. Overview

The CDTP consists of 4 different core parts. Each part is highlighted individually in this user manual. Below you will find a brief explanation of the different parts of the system.
Data Management: In the data management you can see which data can be used for the campaigns and in which quality this data is available.
Audience Management: What can we learn from your customers’ behavior? You can evaluate automatically or self-created target groups.
Credit Card Extension: Get an insight into personal and transactional data and get to know your customers and the merchants they use.
3. Data Management
In the data management you can see which data can be used for the campaigns and in which quality these data are available.
3.1 Data Overview
The data overview dashboard shows you general information about your data, starting with the number of data points and further general statistics to understand which data is integrated into the system. Additionally, it gives you a glimpse about the marketability of your customer base (Marketing Data Potential).
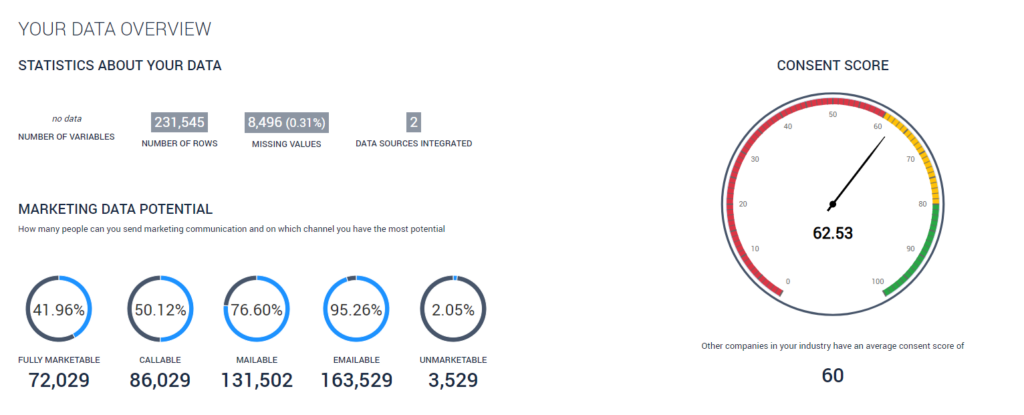
The overview shows how high the opt-in rate is, i.e. on which channels can we send marketing communication to what percentage of customers. A score is automatically generated from this data, which the system compares to an average score of companies from the same industry.

In this section you can see which data is already integrated into the Adtelligence Platform and which data sources could additionally be integrated.
3.2 Data Quality

The Adtelligence Platform automatically generated a Data Quality Score of which you can see the development over time. In the table below, you can see irregularities in your data that influence this score. The software provides concrete recommendations on how these can be remedied.
The score can be influenced if columns are underfilled or there are too high correlations to other columns (which would mean those two columns are close to being identical). Basically, the software only gives recommendations. It must be checked individually for each case whether the warnings in the data need to be corrected or not. For example, it sometimes makes sense that a column is filled almost exclusively with zeros. Nevertheless, the software will give a warning in this case.

You can analyze your data in detail. To do so, select your desired data point in the “Fields” area. A new widget will then appear.

Under “Details” you will find the most common values. For data points where numbers are stored instead of names, min and max values are shown as well in a histogram.
This evaluation is particularly interesting for the marketing department. They get an insight into the data and can examine what data is available.
4. Audience Management
What can we learn from your customers’ behavior? Evaluate automatically or self-created target groups.
4.1 Audience Segmentation
After you have logged in, this start page appears. This dashboard gives an insight into your customers. Here you can view your complete customer base and filter it according to various parameters. You can use the data you have on your customers as well as other parameters provided by Adtelligence.

You can filter the customers by different criteria under “Filter parameters”. To do this, click on a parameter, enter the desired size and click on “add”.

When you have added all the desired parameters, click on “show results”. You will now find the filtered user data on the dashboard. You can save the settings by clicking on “save” so that you can easily reload the filter.

With a click on “save” you can save the selected parameters as a segment and assign a name and description to it. Segmentation is often used to create and save recurring, cross-campaign segments. You can then select the saved segments for each campaign and reuse them in the Campaign Engine.

2. This overview shows how many of the total users match the selected parameters.
3. The table shows customers that match the selected parameters. If no parameter is selected, the table shows all customers. You can adjust the sorting by clicking on one of the columns. This way the sorting refers to this column. Columns marked orange are created by Adtelligence. You can export the results as a CSV. To do this, select the desired columns and then click on “Export CSV”.
4.2 Audience Overview

In this overview you will find the number of your total customers and how many of them are active.

Under “User Generated Audiences” you can find all the manually created segments. When clicking on “Auto Generated Audiences” you will find the automatically generated audiences by the system.
5. Credit Card Extension
The “Customer Overview” section is all about the users of your products. You get an overview of the general trends and developments of your customer base and can filter your customers according to various parameters. Based on predefined categories, the dashboard shows you automatically created personas that give you insights into your user groups.
5.1 Personas
Based on CRM and Creditcard Transaction data, this page gives you an overview of your customers and their buying behavior.

- Category: Transaction data is automatically divided into 50 categories that are easy to understand for marketing and sales. Each merchant that is shown in the system is cleaned and clustered. For example, Douglas is always shown as Douglas regardless of the transaction saying “merchant name = PAYPAL* Douglas”. If you have selected a category, you will be shown the spending of your customers in the selected period. Prepared in clear statistics to better understand who the customer is. Alternatively, you can choose from predefined personas.
- Our software provides a model that allows you to categorize whether a transaction took place online or offline.
- Correlating categories. The software calculates correlating categories per category. This means in which other categories (here fashion) do customers buy who have bought in the selected category (here beauty). This data is ideal for planning and running automatic campaigns like next best spent category campaigns.
5.2 Customer Behavior
Learn more about your customers with detailed analysis.

At the top of the page, you will find the number of transactions, broken down by product.

This view shows how active your customers are. What percentage of users were active in the last 365 days, 90 days, 30 days or 14 days. Active means that at least one transaction was made and that the card was used at least once.

The graph shows you the development of your customer base. In the table you will find the number of customers, the growth, the loss and the delta, broken down by days for the selected period. By hovering over the graph, you can get detailed numbers per day.

Above you can see two analysis views that make different categories comparable. In the screenshot, for example, you can see what percentage of the total transactions and the total revenue were made in the categories Beauty, Betting and Supermarket. Using the widgets, you can optimally analyze the ratio of the transaction volume to the turnover of a certain category. Furthermore, you can see the top and flop categories.
5.3 Merchant Analytics
Analyze your top and flop merchants and leverage those information’s to better understand you customers and find new potential partnerships with merchants.
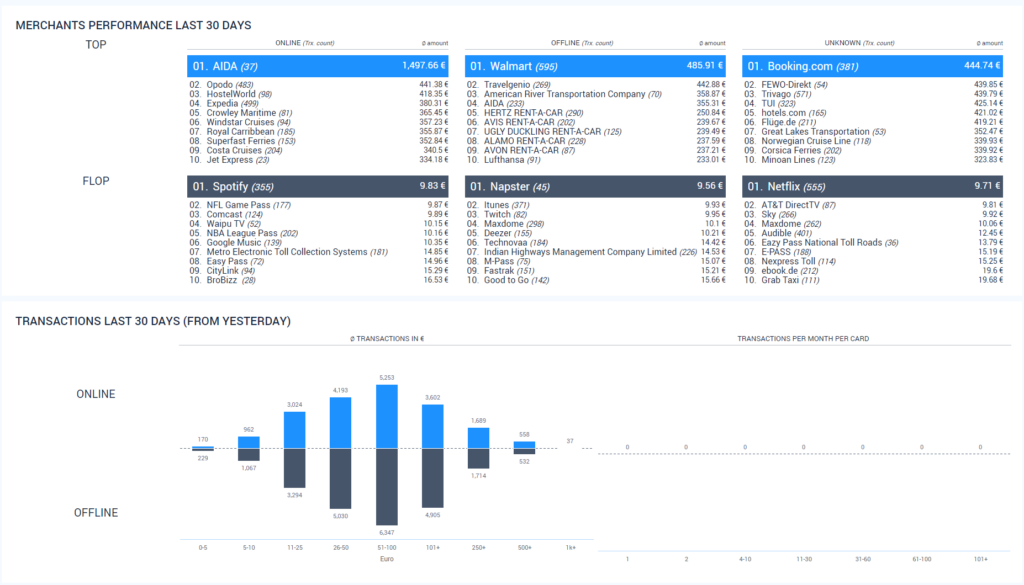
Adtelligence classifies all transactions in online and offline transactions with a custom built Machine Learning Model.
Merchant performance last 30 days shows the merchants with the highest and lowest average transaction volume divided by online and offline.
Transactions Last 30 days shows you the distribution of average transaction volumes online and offline and transactions per month give you a hint on how active your customer base is.
5.4 Correlation Analysis
The software calculates correlations between categories. This means in which other categories do customers buy who have bought in a specific category.
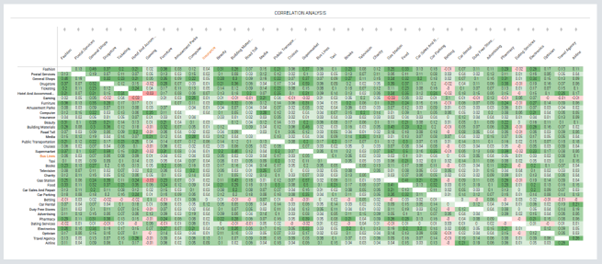
This data is ideal for planning and running automatic campaigns, e.g. people who bought in fashion tend to also buy something in beauty.

In this particular example, the two categories have a correlation of 0.31. This is very high, which is also reflected by the dark green coloring. The green coloring shows that the number is high compared to the other data and not that the value is high in general. If you hover over the correlation, you will see the revenue of the two categories.