1. Introduction
Thank you for choosing the Adtelligence platform.
The Adtelligence platform offers you the opportunity to target visitors of your websites with dynamic, relevant content and significantly increase the conversion rate of your websites.
For this purpose, the personalization software can use all the information and data that the visitor brings via the various marketing channels and finds, in real time, an assignment of the visitor to a visitor segment, as well as optimized page variants and content.
Based on this information, the Adtelligence platform optimizes the playout of layouts, variants and content per segment on the website in such a way that the goals you specify are met optimally and as quickly as possible. For this, the software uses optimization algorithms and artificial intelligence. The Adtelligence platform also provides you with extensive reporting options that give you new insights into your prospects, customers and sales funnels.
This document contains step-by-step instructions, as well as detailed explanations of the individual functions of the Adtelligence platform.
On all views in the system there are help icons , which provide you with relevant information and assistance.
2. Home
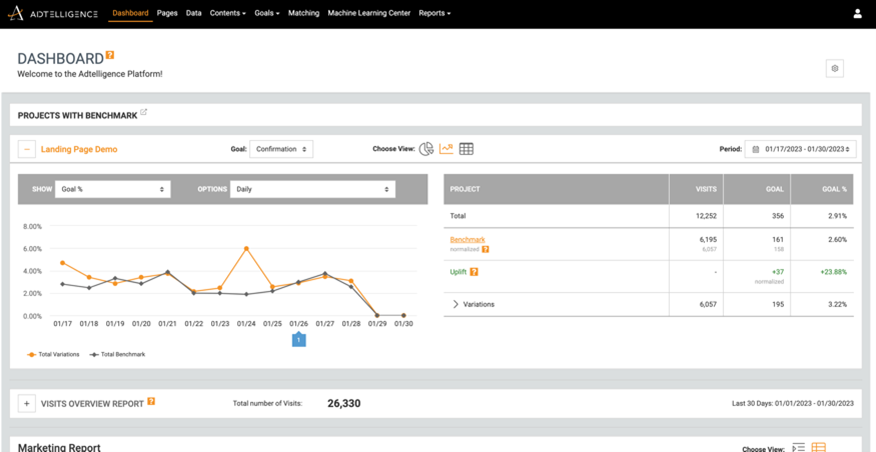
After you have logged in to our platform, the home page will appear.
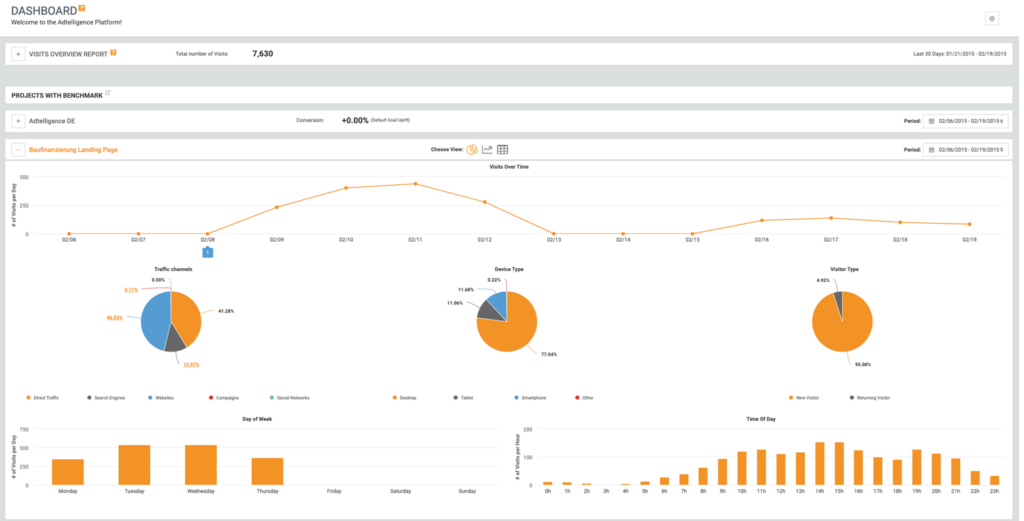
Here you will get an overview of visits to your website, as well as a performance overview of the key figures of your most important projects.
In addition, at the top you will see the menu that allows you to move within the software.
You can also see a history, with accounts that have logged in within the last 24 hours, and real-time statistics of your account, with the number of your live projects, number of layouts, variations and main goals. You can also view the performance overview via Detailed Reports.
Depending on the user role of your user account, you have different rights to access the system and may not see all the menu items described below
3. Account
You can always access your personal account and edit your account. You can reach this menu via your name, in the top right corner of the black header.
Here you can add a profile picture, edit your title and name, change your password, manage a phone number as well as email address and make a language selection between English or German to customize the complete interface to your preferred language.
In addition, a user account can be assigned to several company accounts here with the appropriate authorization, so that this user can use various company accounts with a single login name. For this purpose, the corresponding company accounts must be assigned per user in the admin menu.
A user who has access to multiple company accounts can then switch companies in his account and log in seamlessly.
4. Pages
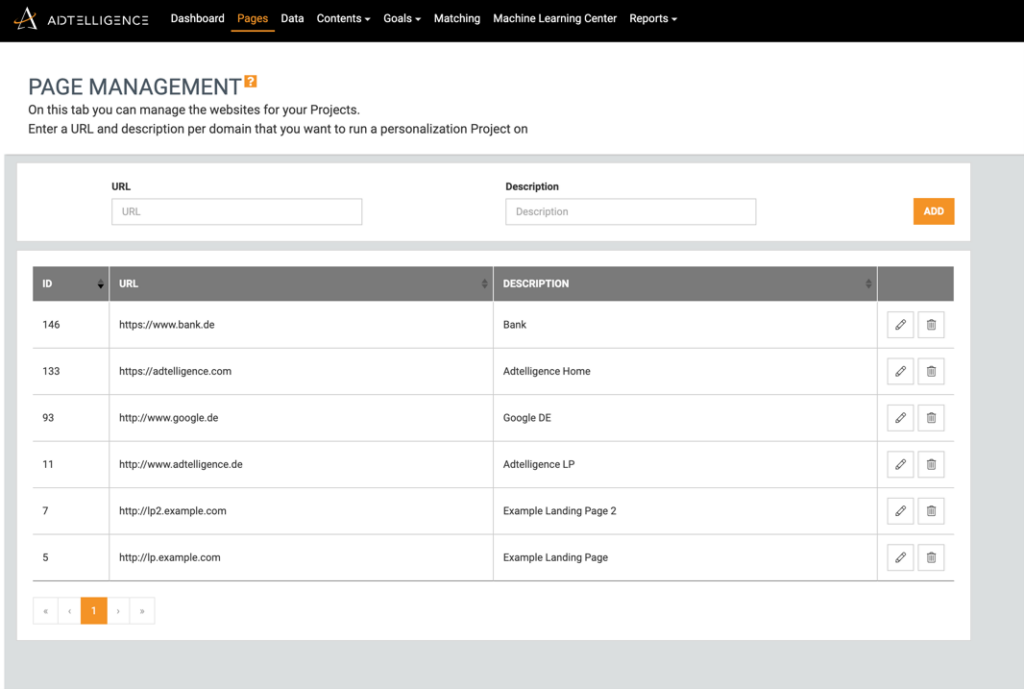
The website management feature allows you to manage different websites and subdomains. Here you can add URL(s) of your websites and a description to the website to be optimized with the Adtelligence platform.
Add the URLs of different domains where you want to place your personalization projects. The websites can be selected to organize your projects in the Page Editor and Matching (Step 1).
Warning:
Deleting a web page that already contains connected projects will delete these projects and thus all data!
5. Data Management
In the data management menu, you manage the data and parameters that you want to use for personalization. Here you can add, remove and edit data sources.
If you have connected additional third-party systems in consultation with Adtelligence, additional data source icons may appear here.
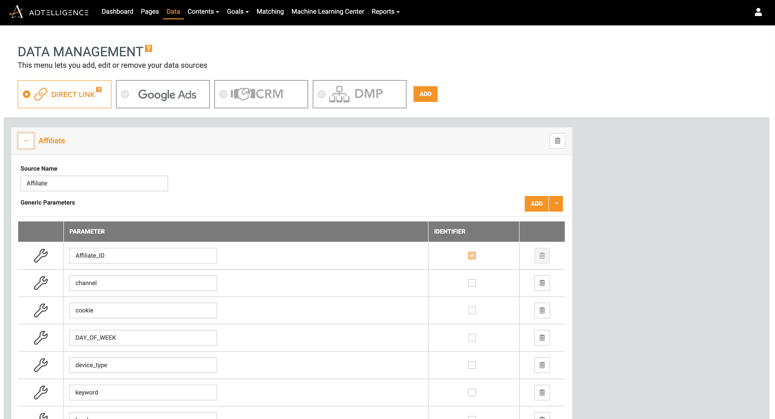
After adding a data source, you have several options to configure the data parameters for it. Using the Add parameter button, you create a new row to configure a parameter. Then you have different functionalities at your disposal:
- Parameter symbols: For each different parameter type, a symbol at the beginning of the line illustrates the respective function. A short help text opens when you move the mouse pointer over the symbols.
- Parameter name: Enter here the names of the parameters you want to use for personalization.
- Default Parameters: The parameter types Browser, Device, Day of Week, Time of Day, Location, Operating System and Visitor Type (first-time or returning visitor) are available parameters by default and are tracked automatically for each data source.
- Autocompletion of parameter names: When entering a parameter name, an auto-complete function helps you to select the appropriate parameter. All parameter names that have already been tracked for your company in a URL are listed here.
- Excel reporting parameter type: If you have activated the Customer Intelligence module, the parameter types for the Excel report can also be optionally selected here. It is possible to select a parameter type for each parameter to make it available for the Excel report.
Further information and explanations can be found in the subchapter Excel Report. - Default tracking parameters: The default parameters are not listed in the Excel Reporting parameter type list. They are automatically available for each data source in each report that contains parameters (such as Analytics, Parameter Heatmap and Excel Report).
- Selection of group parameters: Standard grouping parameters can be added to a data source using the small selection arrow on the “Add” button. Each data source can contain each grouping parameter only once.
Time Group: 0-6h = night, 6-12h = morning, 12-18h = afternoon, 18-24h = evening
Day Group: Mon-Fri = weekday, Sat-Sun = weekend
Device Group: Desktop, Tablet, Smartphone
Direct link data source
Configure a direct link by creating parameters for personalization and tracking that exist, for example, as URL parameters in links that lead to your website.
You set the identifier values for the target group later in the matching. If you choose more than one identifier parameter, your target groups will be identified in the matching by the combination of these parameters.
If you use optimization with Machine Learning, you can select individual parameters as optimization parameters here.
Identifier
In each data source configuration, at least one value must be selected as an identifier that uniquely identifies this data source in the Matching. This ensures that visitors to a data source are assigned to a specific project.
6. Goals
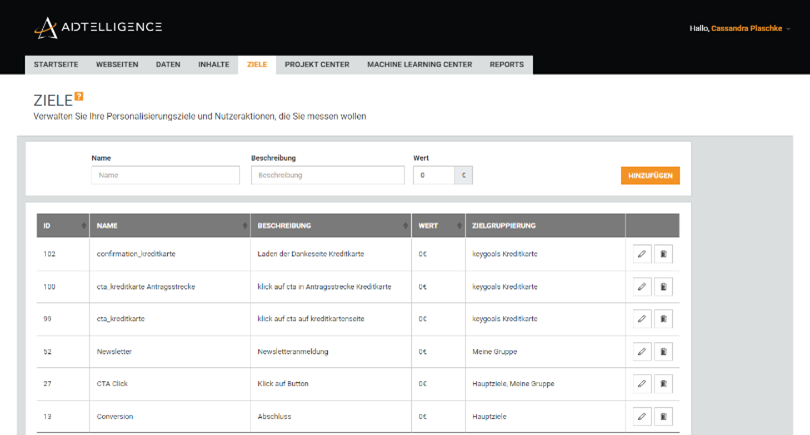
Use targets to track user actions and optimize variant playout. Save and manage all the goals you want to measure here. Define a name for your goal. Optionally, you can add a description.
Then, for the algorithmic optimization, assign an optimization weight between 0 – 100 points for your new target, depending on its importance. A high value corresponds to a high importance for the optimization algorithms. A target with weight 0 is only used for tracking and has no influence on the optimization. Once created, targets appear in the table below and can be edited or deleted at any time.
Notice:
Please note that when you delete a destination, all data for that destination will be deleted and will therefore no longer be available.
7. Goal Groups
Goals can also be managed in groups. For this purpose, there is a menu item “Goal Groups” under Goals.
For a new group of targets a name and optionally a description is assigned. Then, from the list of all targets, those to be added to the group are selected. The created groups are displayed in the table and can also be edited or deleted there.
8. Matching
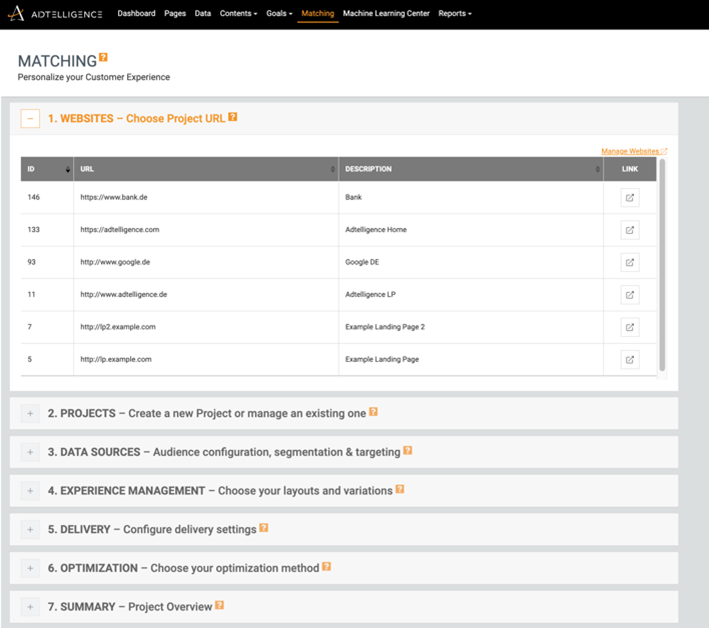
Use the seven steps of the Matching to configure your personalization projects. Connect the website, data source, variations, targets and set the playout and optimization method.
Step 1 – Websites
The first step is to select a project URL defined by you for which you want to set up a project.
Notice: A shortcut to the Website Management tab to edit your website domain can be found on the right under Manage Websites.
Step 2 – Projects & Activities
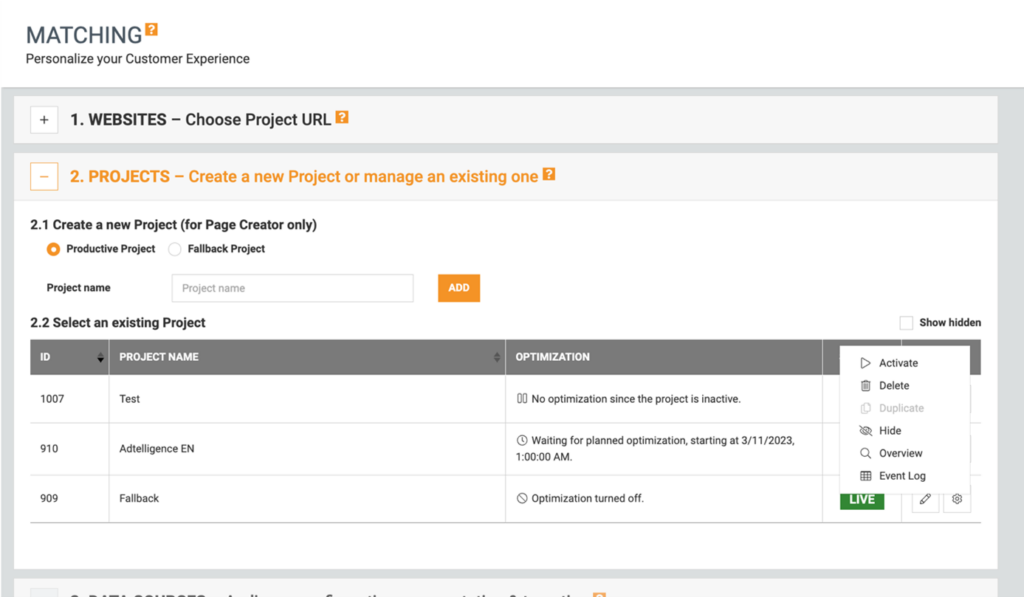
In this step you can create a new project or manage an existing one.
When creating a Page Manager project, use Section 2.1 and assign a project type and name. A fallback project allows you to select a specific variation or redirect in case an identification parameter is detected for a visitor, but it cannot be uniquely assigned to an existing project. Select a productive project for your planned live visit.
Page Editor projects are not created in 2.1, but are already listed in the table in point 2.2 and can be selected from there to configure them in the following steps.
All projects can be edited via the gear icon. Projects can also be hidden here if they are no longer used live, but already generated figures are to remain for later reporting.
Show hidden projects again
In the Matching, hidden projects can also be shown again, e.g. to turn them live again.
When fading in, the project is first made inactive. Thus, it is not immediately live, but still allows configurations to be made to the project before it is reactivated and then made live.
Step 3 – Data sources
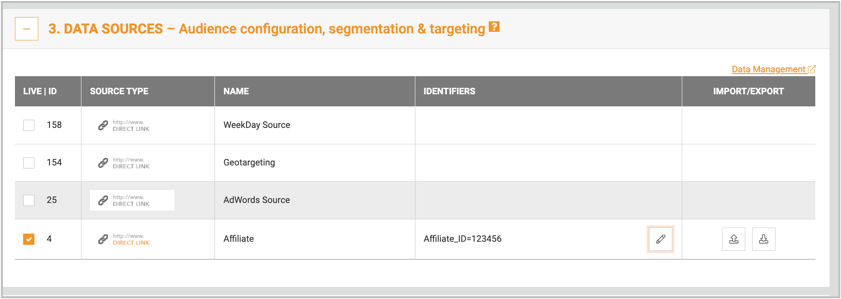
In step 3 you can link your data sources to the selected project. The data sources can be managed in the Data Management tab.
Direct Link Data Source
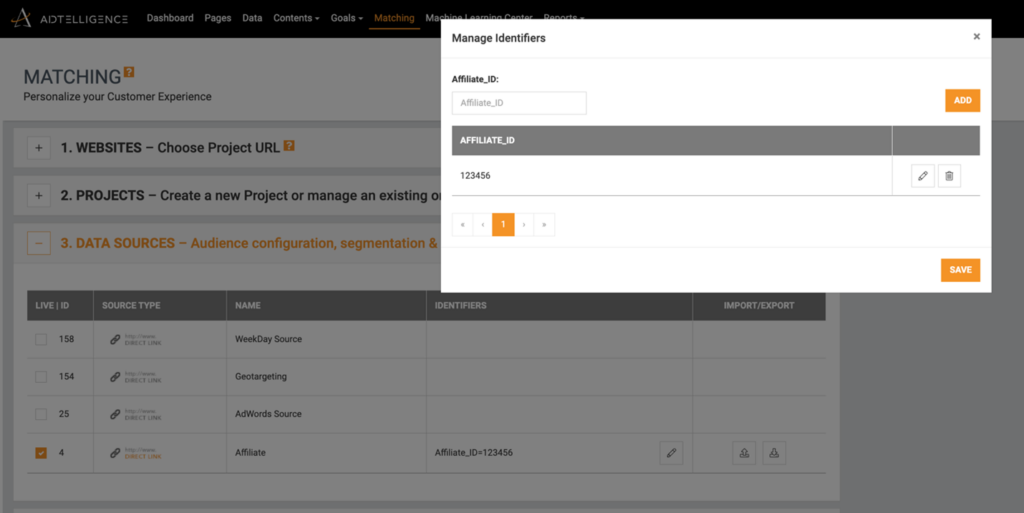
When you select a Direct Link Data Source, the selected identifier name(s) is/are displayed. In the free text field below, enter all values for which the currently configured project is to be played out.
Download all identification values
You can download and edit all identifier values as a csv file. This allows easier management with many identifier values stored directly in spreadsheet software such as Microsoft Excel.
After editing, the csv file can be saved and easily uploaded again via the csv upload to apply the changes to the identifier values in the project
Step 4 – Experience Management
In the next step you will get an overview of your website variants.
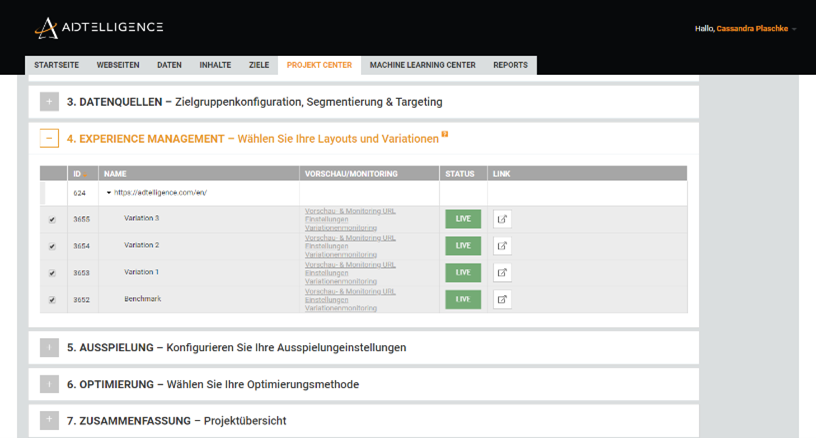
If you configure a Page Manager project, you must now select the variants to be used in the project in this step. In the list you will see all the layouts that have been created and when you expand them, their variants. Select the desired variations for this project. All selected variants are highlighted in orange. Layouts that contain selected variants are highlighted in black, layouts without selected variants are highlighted in gray. Variants written in bold are active, variants written normally are inactive (status: disabled). Via the magnifying glass icon you can see a preview of the respective variant.
Variation monitoring
For each selected variation, you can optionally configure automatic monitoring that automatically monitors whether visual changes to the variation take place. As soon as the web page changes (e.g. due to adjustments in the CMS of the underlying website) and the difference exceeds a certain tolerance level, an email is automatically sent to alert the user of the change.
URL configuration
Under Preview and Monitoring URL settings, the address for the preview images (e.g. for Excel reports and the preview in the Details report) and the monitoring can be stored.
Monitoring configuration
Under Variation monitoring and click on Edit configuration the monitoring settings are made.
In the upper area, the project name, variant name and the monitoring URL to be monitored (from the previous setting) are displayed for overview purposes. In the second area, the monitoring settings can be made individually:
- DOM selector
- To monitor only a certain part of the web page, the name of the DOM element to be monitored can be inserted here.
- Hide elements
- Can optionally be used to specifically hide individual elements of the page for monitoring, e.g. advertising spaces that change frequently.
- Multiple CSS DOM selectors separated by ‘;’ can be entered here.
- Waiting time
- If the website generally takes longer to load, a higher value should be entered here so that the screenshot is not created too early. The waiting time should be between 1-120 seconds.
- Enable sending an email in case of deviation
- The tolerance can be defined in the max. deviation field. The email addresses for notification recipients can be stored in the Admin UI.
- Max. deviation of the screenshot from the specified basic version
- As soon as the difference exceeds this value, the e-mail notification is sent. The max. deviation should be between 0.1-100%.
- Devices – select the types of devices for which the web page should be monitored.
After the monitoring configuration has been created, the entire project must still be saved in step 7 in order to start monitoring.
To stop monitoring for a variant, simply deselect all device types, save the configuration and save the project.
Before/After Slider
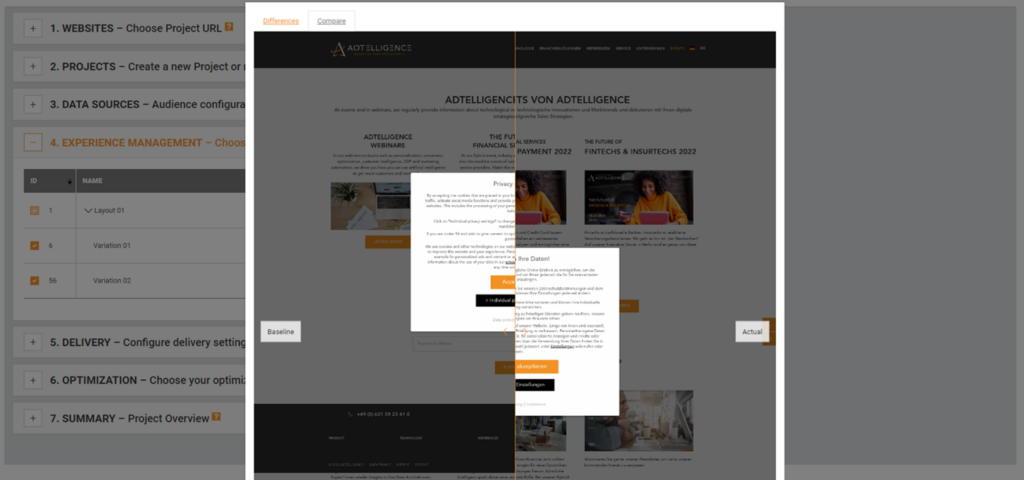
Sie können direkt sehen, was sich auf Ihrer Website geändert hat (gelb markiert).
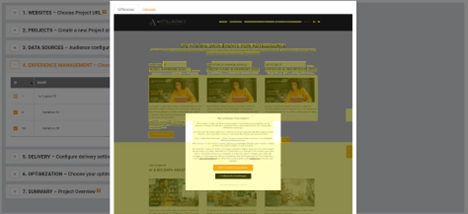
With an easy-to-use Slider you can slide between the two variations of your website you are comparing.
Step 5 – Delivery
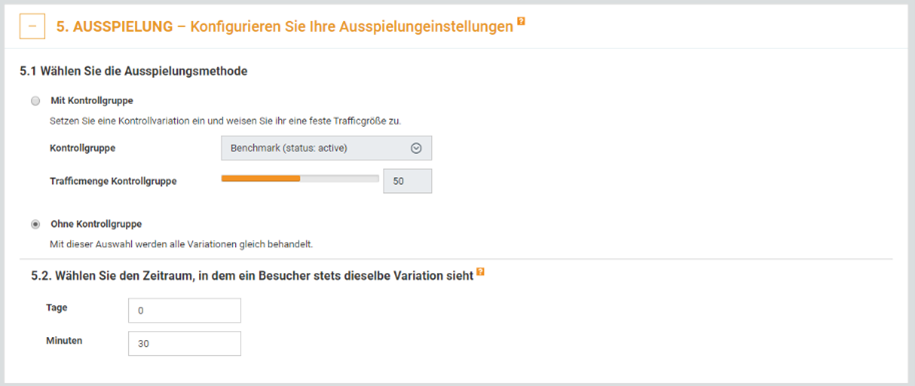
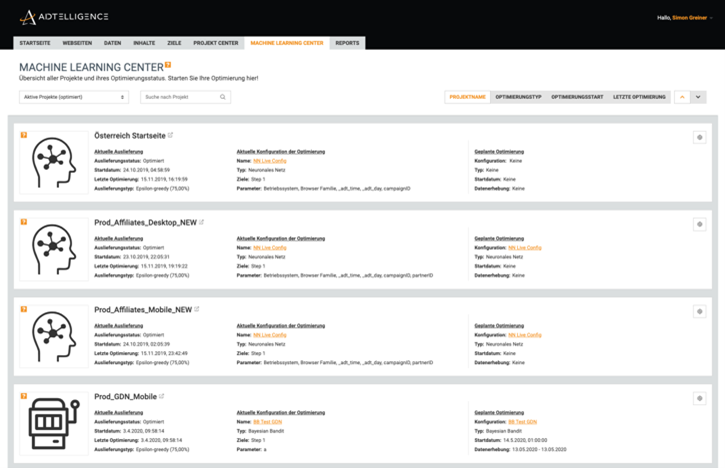
In section 5.1 to 5.3 you can set the playout.
In section 5.1 you choose whether you want to work with or without a control group.
- “With control group”: Here, a selected control variant is assigned to a fixed percentage of the visitors. Select the control variant and the fixed percentage. The remaining traffic will be distributed among the other variants depending on the setting
- “Without control group”: Here, no fixed percentage is assigned a variant, but all variants of the project are treated equally. Depending on the playout method in 5.3, either all variants are played out equally distributed, or an optimization takes place by the system, so that variants are played out optimized.
In Section 5.2, you can set a time period during which the same variant is played to a visitor on the same page. By default, this is 30 minutes.
Step 6 – Optimization
In the next section you define the playout method. Depending on the Adtelligence modules you have purchased, the following options are available:
- No optimization – this causes all variations to be displayed equally distributed.
- Optimization with Machine Learning algorithm – this activates Machine Learning.
- Variations – better performing variations are played out more often. The algorithm adjusts scores and traffic distribution with each user action 24/7.
- Optimization with AI: Neural network – this activates artificial intelligence. The Neural Network learns the dependencies and importance of each parameter.
- In addition, the date at which the optimization is to start can be selected for Machine Learning. The algorithm or the Neural Network will first collect data up to this date. The default setting here is one week.
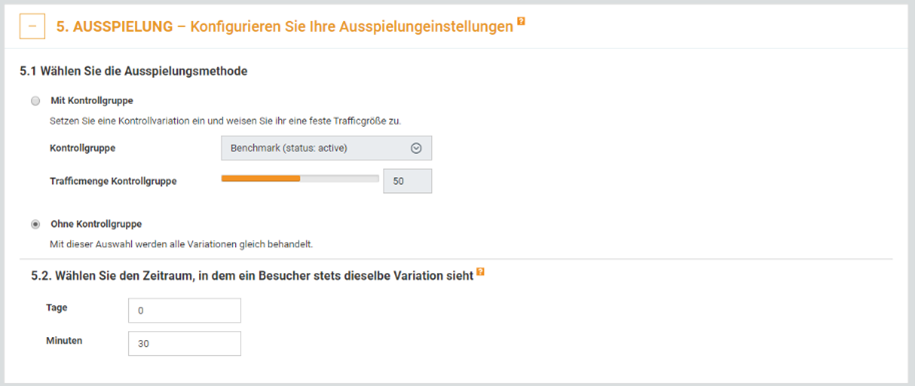
9. Machine Learning Center
In the Machine Learning Center you can get an overview of all projects and how they are currently optimized or which optimization is planned for the future.
In order to start an optimization, an algorithm must first be selected and a configuration created for it. There are three different algorithms to choose from in the Adtelligence system.
Algorithms
- Reinforcement-Scoring Algorithm
- Neural Networks
- Bayesian Bandit
Configuration of an algorithm
Each algorithm is to be configured differently and has different settings. The respective configuration is divided into different thematic sections, which are described in more detail below.
Configuration Reinforcement-Scoring Algorithm
General
The first step is to specify general information in the algorithm configuration, such as name, description and the time of the optimization start.
Data collection phase – This field can be used to decide whether the algorithm should optimize the project directly or whether a data collection phase should precede it. In this phase, the system initially only collects data about users and their behavior and then starts an optimization based on a suitable database.
Use only equally distributed data – This field determines which data will be used for optimization.
Targets
In the goals area, you can specify the goals that the algorithm should optimize for. Here you select the target and give it a weighting between 0 and 100, according to the strength of the weighting of the target.
Training schedule
This section defines how the algorithm optimizes and what data it uses as a basis for optimization.
The first option is “one-time optimization”. Here, data from a specific period in the past is used to train the algorithm and create scores for the individual personalization variants. These scores are then used to play out the web pages from the moment the configuration is activated.
The second option is the “Recurring optimization”. Here you can set how many days in the past the algorithm should use data and whether it should recalculate the scores daily on a certain day of the week or on a certain day of the month.
Optimization parameters
In the Parameter section, select the parameter on the basis of which the algorithm is to optimize. In the case of the scoring algorithm, this is only one parameter per configuration. For example, scores would be created per campaign name per personalization variant if you would optimize on the parameter campaign name. [CP1]
Hyperparameter
Hyperparameters are usually settings that change the way the algorithm works. For example, you can change the “Optimization Decay Factor” and the “Delivery Score Factor” of the scoring algorithm.
Optimization Decay Factor
The Optimization Decay Factor (ODF) is used in the calculation of new scores as follows:
Score = (newScore + ODF * oldScore)/(1 + ODF)[CP2]
The default ODF is 1. An optimization factor greater than 1 means that the old score has a higher weight than the new score, an optimization factor less than 1 means that the new score has a higher weight than the old score.
Delivery Score Factor
The Delivery Score Factor (DSF) is used to select a variation.
For each variation, the optimization value is exponentiated by DSF.
The default DSF is 1. A factor greater than 1 means that good variants are selected more often and vice versa.
Neural Network Configuration
General
The first step is to specify general information in the algorithm configuration, such as name, description and the time of the optimization start.
Data collection phase – This field can be used to decide whether the algorithm should optimize the project directly or whether a data collection phase should precede it. In this phase, the system initially only collects data about users and their behavior and then starts an optimization based on a suitable database.
Use only equally distributed data – This field determines which data will be used for optimization.
Targets
In the targets area, you can specify the targets that the algorithm should optimize for. Several targets can be selected here.
Training schedule
This section defines how the algorithm optimizes and what data it uses as a basis for optimization.
The first option is “one-time optimization”. Here, data from a specific period in the past is used to train the algorithm and create scores for the individual personalization variants. These scores are then used to play out the web pages from the moment the configuration is activated.
The second option is the “Recurring optimization”. Here you can set how many days into the past the algorithm should use data and whether it should recalculate the scores daily on a certain day of the week or on a certain day of the month.
Optimization parameters
Select the parameter on the basis of which the algorithm is to optimize in the parameter area. In the case of the Neural Network, at least two parameters per configuration must be selected.
Hyperparameter
Here we recommend the automatic configuration for the Neural Network. Nevertheless, the settings can be adjusted in the expert mode.
Configuration Bayesian Bandit
General
The first step is to specify general information in the algorithm configuration, such as name, description and the time of the optimization start. The default optimization start is the following day.
Targets
In the targets area, you can specify which target the algorithm should optimize for. You can select a maximum of 1 target per configuration.
Optimization parameters
In this section you can select the parameters on the basis of which the algorithm should optimize.
Hyperparameter
First, the algorithm type is selected for the Bayesian Bandit. When setting the algorithm type, the main issue is how fast the algorithm should react to a change in conversion rate or traffic volume.
Here, you can either focus on the best performing variation and test the rest of the variations only a little, which could lead to semi-optimal performance if the environment changes quickly. Or you can focus on the ability to react quickly to certain changes in the environment, in which case you would always test all variations regardless of past performance.
To have the optimal balance between both scenarios, we recommend the “Standard” setting for the project start.
Proven examples:
You have a long-term campaign that runs for months → Select “Long-term optimization”.
You have little traffic on your website, but still want to personalize → Select “Standard”.
You have many small campaigns running, each only a few weeks and the traffic volume changes often and quickly → Select “Fast changing environment”.
Border
A playout variant has a “certainty”, which indicates how reliable the data basis is. The “limit” indicates how safe a playout variant can become at maximum. The lower the value, the more experimental variants (even with a lot of data) are played out. Possible values here are between 50 and 1500. The default value is 400.
Decay
A playout variant has a “certainty”, which indicates how reliable the data basis is. The “decay” indicates how quickly this certainty decays with each training. This means that older data is evaluated as less important and therefore it is possible to react faster to changes. Smaller values mean faster decay. Possible values here are between 0.5 and 1. The default value is 0.99.
Optimization settings
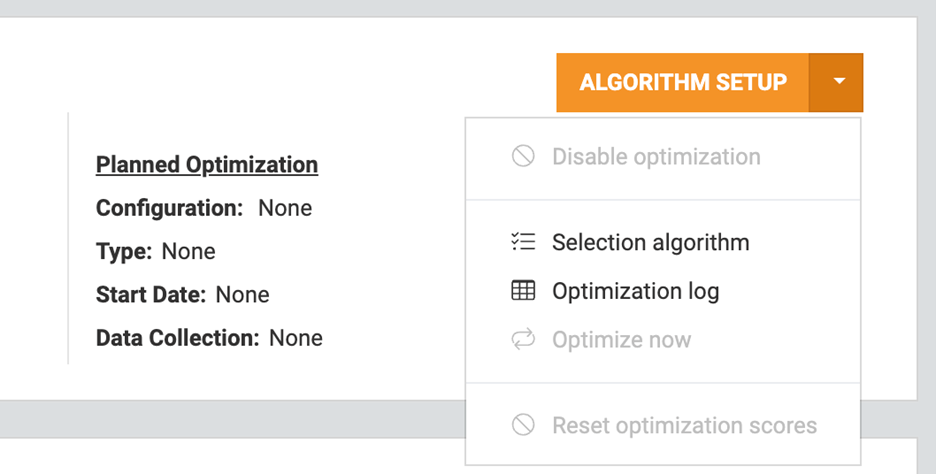
On the Machine Learning Center Overview you can click on the arrow next to “Algorithm Setup”to make even more settings to your optimizations.
Selection algorithms: Epsilon -Greedy: If you select Epsilon-greedy, the best variation from the ranking is played out at the set percentage; the remaining variations including the best variation are played out equally distributed to the remaining percentage.
Optimization log: Here you can view all past optimizations
Optimize now: To start the optimization immediately
10. Reports
Performance
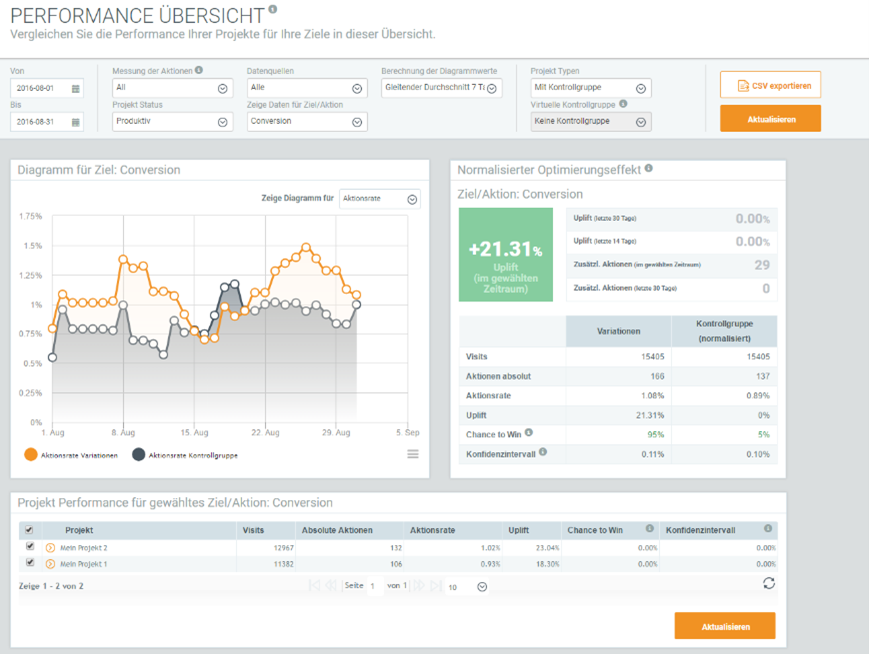
The Performance Overview Report shows a summary of the performance of your projects. You can access this display via the Reporting tab of the Adtelligence Platform UI or directly by clicking on the Performance Report in the Dashboard Overview.
With the filter you can influence the selection of data that the report will throw out. Choose the measurement type of the actions for your targets:
- Unique – the number of achieved goals/actions is counted at most once per visit, even if it is more frequent.
- All – a goal/action is counted several times within one visit.
Example: If a visitor triggers a specific goal/action (e.g. button click) three times within a visit, this goal/action is calculated as follows: Unique: 1, All: 3
In addition, select the data sources you want to have displayed in the statistics.
Selection options for project status:
- Productive – A productive project for your live walk.
- Developer – A developer project does not perform tracking and should only be used during the integration phase.
- Fallback – Traffic is directed to this project if the identification parameter is missing and the Adtelligence platform cannot direct the user to the correct project because it does not recognize the data source.
- Productive & Fallback – Both Productive and Fallback projects are selected.
- All – All projects are included.
- Hidden – Hidden projects are also included.
Then select the desired destination. In the selection, main destinations are listed first and after a hyphen all other destinations.
There is also a possibility to select different options for the calculation of the graph values:
- Daily – Daily statistics without moving averages on.
- Moving average 7 days – For each day the average of the action rates of the previous 7 days is shown.
- Moving average 30 days – For each day the average of the action rates of the previous 30 days is shown.
With the selection “Project types” you filter projects according to their playout method. If you select “Without control group”, you can optionally set a virtual control value for the performance calculation (see below).
Then refresh the report to calculate the performance figures for your selection. You can also select individual projects at any time by selecting them in the table below and clicking Refresh. All charts and values always adjust to the selected projects.
In the chart area there is a selection box at the top right. Here you can switch between action rate, visits and absolute actions. The “Normalized optimization effect” table to the right of the diagram shows the most important KPIs.
In this section of the report, normalized values are calculated and presented to create comparability of performance between control groups and variations. The free choice of traffic distribution of individual projects usually creates an imbalance in traffic and they cannot be easily compared.
Normalization mathematically ensures equal distribution and calculates the resulting values. During normalization, visits and actions or goals are subsequently scaled in such a way that the number of visits is equally distributed between project variations and the control group. This allows a statement to be made about how high the uplift is under the assumption that all project variations and associated control groups would be played out in an equally distributed manner.
The table below the chart shows the project performance for a selected target. Here you can see the overall performance of your projects based on visits, absolute actions, action rates, uplift, chance to win and confidence interval.
If you want to select only specific projects for which you want to see diagram & normalized values, select the desired projects via the checkbox in the first column of the table and click on Update. All diagrams and normalized numbers are always calculated and displayed for the projects selected here.
Virtual control group
In the Performance Report, you also have the option of comparing projects that were set up without a control group against a control value in order to evaluate their performance even more precisely. You can choose between a fixed control value or the selection of a variant as a virtual control variant.
The selection is located on the far right of the Performance Report control area and is activated as soon as you select “Without control group” for the project type, i.e. projects set up in the Matching without a control group. In this case, the “Virtual control group” control box is activated and offers three choices.
No control group: there will be no control group for the performance data; therefore, no control graph will be available in the chart and no uplift will be calculated.
Fixed control value: Use the input field to set a fixed control value. After updating the report, all performance data will be calculated against this fixed value, therefore a straight line will be displayed in the graph and the calculated
Select control group: Select this option to choose one of the variations of your project as a virtual control group. Refresh the report and use the table below to select which projects are included in the calculation in the front column and select a variation as the control group for each enabled project in the last column. After refreshing the report, all selected control groups will be treated as virtual control groups and both chart and normalized uplift numbers will be calculated and displayed accordingly.
Details Report
Use the Detail Report to analyze the performance data of all projects and variations. Use the filters at the top to select time period and for further adjustment.
- On the first level you will find the aggregated values for each existing data source. You can expand the data source types and select the desired sources. By clicking on the “Show projects for selection” button you will get an overview of all projects for this source(s).
- If a target group is selected, only those targets of the target group are listed in the evaluation table. Thus, the reported key figures can be managed and tailored more precisely in the detailed report.
- The second level lists all projects for the selected source(s) and shows more individual performance data for these projects. Here you can expand individual projects and evaluate the performance within each project at group or variant level.
- At this level, you also have the option to view the performance values for all data parameters for each variant. To do this, click on the green Details link.
- Select desired projects or variants and use the “Show diagrams for selection” button to view a graphical comparison.
Within the diagram, preset filter options can be customized again, such as the selection of a specific target or the calculation of the diagram values. By clicking on the “Update diagram” button, the new filter options are applied to the diagram.

Excel Report
With the predefined Excel reports you can download your performance data in ready styled and clear Excel sheets, thus they do not process raw csv data.
Use the filters above to select the time period and configuration. Then select the data types for your Excel report and confirm with the Export Excel button. The report will be generated live and sent to your user account email address within moments.

Optimization Report
The new AI Performance Report allows you to see the influence of the Adtelligence algorithm on the conversion rate at a glance. For this purpose, the performance of optimized variants is compared with a simulated equally distributed playout of the variants.
Our personalization engine works with different variants of a page. In concrete terms, this means that different variants are created for a product page, for example, which differ in terms of text, images and layout and thus address different user needs.
The Adtelligence algorithm comes into play when these variants are displayed. It decides which user gets which variant displayed. The decision is made on the basis of a defined target and various data points provided by the user. In this way, each user sees the variant that meets their needs and has the highest probability of conversion.
The AI report shows how strong the influence of an optimized playout is and how many conversions there would have been if the traffic had been distributed evenly, i.e. randomly and without any optimization.
The report compares both types of playout. Thus, it can be shown at a glance how strong the influence of the algorithm is on the target achievement. This report is unique on the personalization market with its simulation of a uniformly distributed delivery and the resulting possibility to show an AI effect.
Below is a step-by-step guide on how to configure the report.
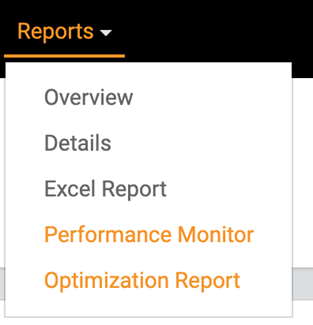
1. Click on “Optimization Report” in the navigation bar under “Reports”.
2. After you click on “Add”, a dialog box will appear where you can define the scope of the report.
- Name: Assign a name for the report.
- Project: Select a project that you want to evaluate.
- Displayed variants: All active variants are automatically selected here, but can be removed by clicking on them. All selected variants will be evaluated.
- Dimensions: Select one or more parameters to analyze their effect on goal achievement.
- Target: Select a target to which the algorithm optimizes in the selected project.
- Time period: Specify the time period to be evaluated.
- Base variant: With the help of the base variant, you can determine the effect of the different variants on the conversion rate, compared to the playout of a single, static variant. For each project without a fixed benchmark variant, you can set a base variant against which the performance of the personalization is measured.
3. Click on “Save” to generate the report.
4. After a short waiting time you can click on the magnifying glass icon to open the report.ern”

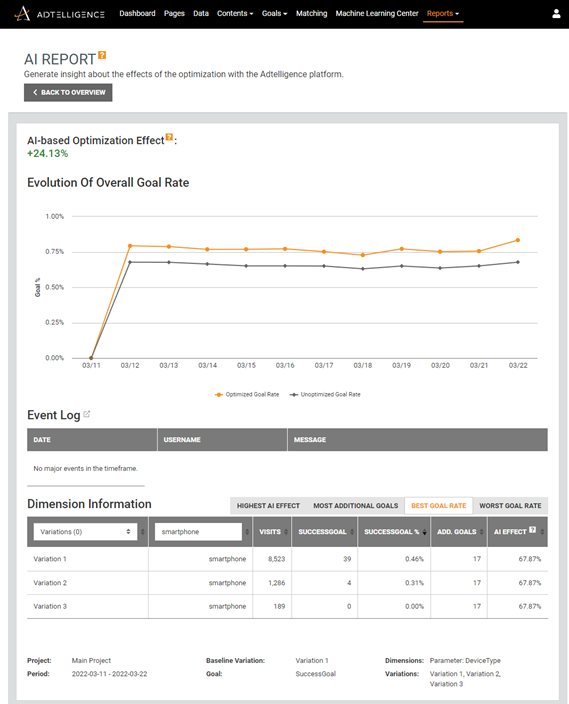
The “AI-based Optimization Effect” indicator shows the effect of the intelligent playout of variants via the Adtelligence algorithm. For this purpose, the number of conversions actually achieved via the Adtelligence algorithm is set in relation to the conversions of a simulated, equally distributed playout of the variants. The graph shows the development of both the non-optimized and the optimized conversion rate over time.
The optimization effect can also be analyzed in the detailed table according to individual customer contexts and different customer segments in order to generate even more insights from the optimization. In the screenshot, for example, the “smartphone” segment is filtered. The optimization effect on this segment is 67%, while the overall effect is only 24%. In the example, the smartphone users show the best target achievement on the variant 1. This variant gets the largest part of the traffic by the algorithm.
If you look at the screenshot at the top of the page, you can see that the influence of the algorithm differs depending on the filtered parameter “Device-Group”. The algorithm has the greatest influence (67.87%) on the smartphone category.
APPENDIX
User roles concept
The Adtelligence platform works with user roles. Each user who gets access to the system has a user role that determines which settings in the system he is allowed to see and what rights he has. There are the following user roles:
- Administrator
- User
- Reader
- Reporter
- Developer
The following table lists the available views per user role:
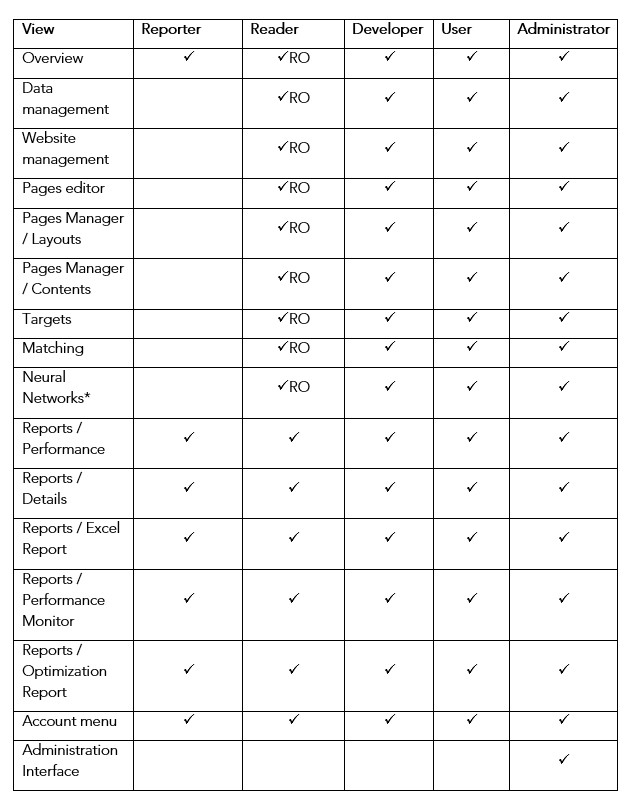
Check = full access to the view
CheckRO = read-only access to the view, i.e. no functional changes or executions (e.g. edit, delete, save) possible.
Information on the calculation of selected KPI values
The confidence interval indicates the range in which the action rate/conversion rate for the selected target statistically moves. The action rate is subject to fluctuations that become smaller as the number of visits and actions achieved increases, since the rate can be predicted more accurately. The confidence interval thus provides information about the expected action rate. A confidence level of 80% is used here as the statistical basis. Example: If a variation for a target has an action rate of 2.35% and a confidence interval of 0.05%, the expected action rate for 100 cases will be in the range of 2.40% to 2.30% 80 times.
Chance to win is a measure of significance of statistical values that indicates the relative probability of whether a variation and/or a group of variations will produce better results than the control group for the selected target. Example: If group B has a chance to win of 80%, it has an 80% probability of achieving better performance for the selected objective than control group A.