1. Introduction
The Acceleraid Platform leverages artificial intelligence and all available customer data like transaction data and CRM data to get a holistic view of your customers and provide them with the exact offer that suits them at the right time. Seamless customer experiences with satisfied customers in an ongoing dialogue ensures a continuous increase in sales.
The Acceleraid platform offers state-of-the-art machine learning models out of the box for all use cases along the customer lifecycle. You only have to configure them, not program them. You don’t need any data science knowledge, Adtelligence has integrated the autopilot and was awarded the AI Champions Award by the state of Baden-Württemberg for this. You can learn more about the simple and intuitive implementation of the platform in this manual.
2. Overview

The system consists of 2 different core parts. Each part is highlighted individually in this user manual. Below you will find a brief explanation of the different parts of the system.
Campaign & Decision Engine: Create, edit, configure and optimize all your campaigns in a simple flow and use it as your cockpit for your customer communication.
Campaign reporting: Directly measure the performance of the campaigns, see how much additional conversions and revenue was generated, by analyzing each campaign individually.
3. Campaign & Decision Engine
After we have brought together your data sources and made them usable, we automate use cases for you. This automation takes place here, making the Campaign and Decision Engine the heart of the complete system.
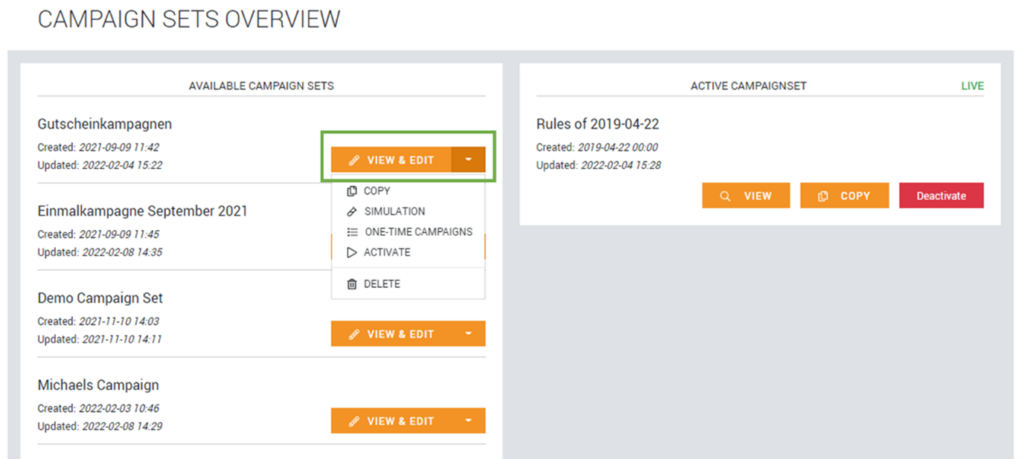
You get an overview of all your available campaign sets. You can see when they were created and last updated. By clicking on the arrow next to “View & Edit”, you can copy the campaign, start a simulation, view the One-Time Campaign History and activate or delete the campaign. Clicking on “View & Edit” takes you to the Campaign Editor.

With all the data you provide, rules can be created and use cases can be automated. Click on “enable edit mode” to enter the editing mode and edit the campaign.
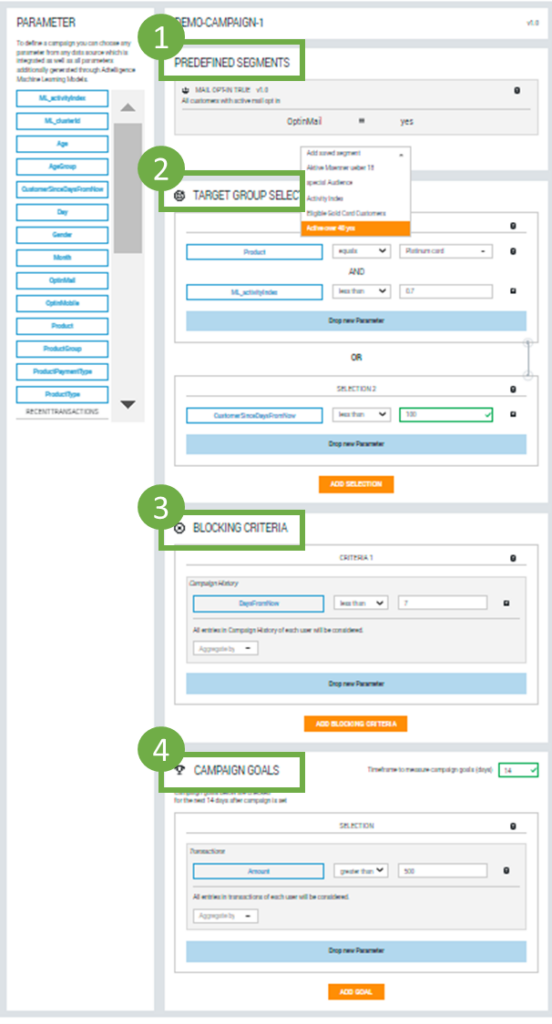
On the left-hand side you will see a selection of the parameters available to customize the campaign.
- Predefined Segments: Here, predefined segments can be selected. For example, in this case a segment is applied which filters the users who have given an opt-in. Under “Add saved segments” you can select the predefined segments. Commonly general exclusion criteria are saved as a segment so they can be used for all campaigns directly.
- Target Group Selection: Filter your target group according to certain parameters. You can drag and drop parameters from the left column into the “Drop new parameter” area and include them in the filter. The individual parameters can be linked with “and” or “or”. In this example, the target group was filtered as followed: Platinum Card holders who have an activity index below 0.7 or have been customers for less than 100 days. The left field shows the parameter, the middle field the comparison operators and the right field the selection options of the particular parameter.
- Blocking Criteria: You can set an exclusion criterion. In this case, all users who got a campaign in the last 7 days are excluded from the target group.
- Campaign Goal: Select the goal of the campaign. In this example, the user should make a transaction in the following 14 days after he got the message, and the transaction should be greater than €500.
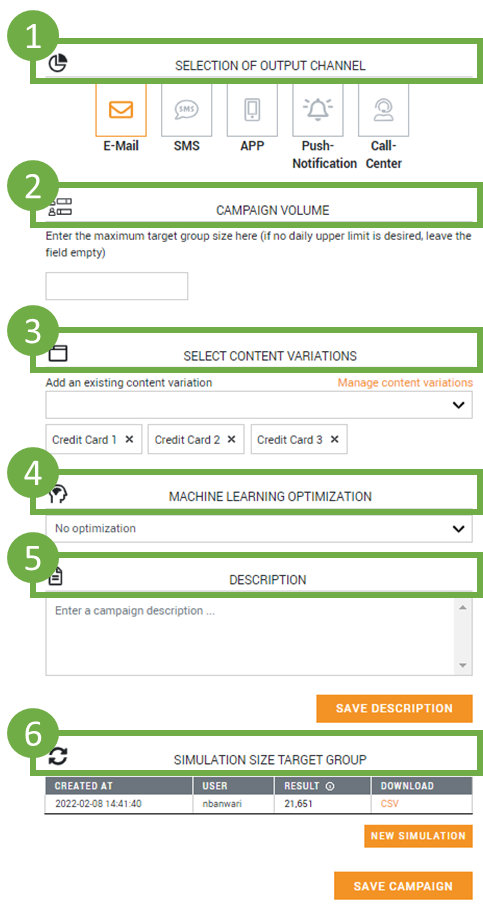
On the right-hand side you can make the following settings.
- Selection of output channel: Select the channel through which your customers should be addressed. The following channels can be connected with our Adtelligence solution: Email, SMS, App, Push-Notification, Call-Center. In this case, the channel E-mail was selected.
- Campaign Volume: Enter the maximum target group size per day here (if no daily upper limit is desired, leave the field empty).
- Select Content Variations: In the last step of the optimization process, the Adtelligence algorithm can be given different content variations. In this example, there are three different variations of the email campaign. The algorithm automatically optimizes which content variation the customer will receive best based on the parameters given to achieve the defined goal.
- Machine learning optimization: Select whether your campaign should be optimized with an algorithm or be sent without optimization. If you choose the Bayesian Bandit, you can adjust the algorithm and personalize it to your needs. The setting options are explained in more detail in the screenshot below.
- You can add a description and save it by clicking “save description”.
- Simulation size target group: Before you save the campaign, you will see a simulation how many customers would get the created campaign not considering all other campaigns which are in this campaign set.
- You can now save the campaign by clicking “save campaign”.
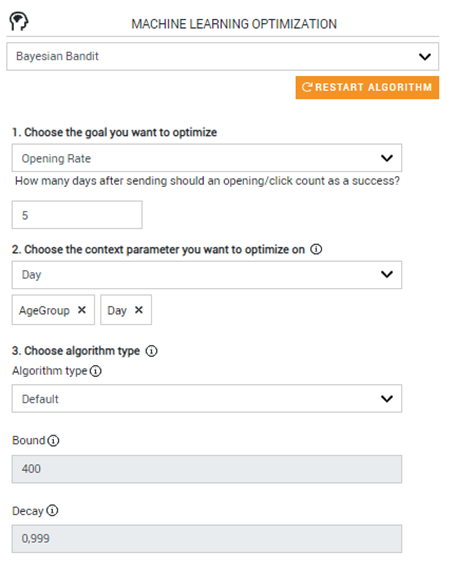
Below is an explanation of how to customize the Bayesian Bandit to your needs.
- You can select a target that the algorithm will optimize on. The possible targets are Opening Rate, Click Rate or any Success Condition you like. The success condition is completely flexible and you can configure goals on the basis of all data delivered to Adtelligence, e.g., did customers make a transaction in a certain category after receiving the E-Mail or did customers install the APP. You can set, how many days after sending an opening/click should count as a success.
- Choose the context parameter you want to optimize on. In this example, the algorithm optimizes for AgeGroup and Day. This field can also be empty, in this case the algorithm would optimize which variation works best for all customers in this campaign not specifically for certain contexts.
- You can select one of the following algorithm types: Default, Longterm Optimization, Fast Changing Environment.
- A variation has a certainty, which indicates how reliable the data basis is.
- The “bound” specifies the maximum level of certainty that can be achieved by a variation. The lower the value, the more experimental split between the variations is (even with a lot of data). Possible values are between 50 and 1500, the default value is 400. By setting a bound you can make sure that an algorithm keeps learning, otherwise it could get too certain, that one variation is the best for the target group and only deliver this one solely from that point on.
- The “decay” indicates how quickly this certainty expires with each training session. This means that older data is considered less important, and you can therefore react to changes more quickly. Smaller values mean faster decay which means older data is irrelevant quicker. Possible values are between 0.5 and 1. The default value is 0.999.

In the Campaign Sets Overview you can now activate the campaign by clicking the arrow next to “view and edit” and then on “activate”. Once you have activated the campaign, you don’t have to do anything. From this point on, e-mails are automatically sent to the customers targeted in your campaigns.
4. Campaign Reporting
After your campaigns have been delivered, you can analyze them in different ways.
4.1 Campaign Overview Report
You can find an overall report here, where you can see an overview of all the automated campaigns you have created.

At the top of the page, you can apply various filters to the report. Select the period you want to evaluate. You can also filter according to the following criteria: Age group, Gender, Product, Product Group, Payment Method, Use Case Variant, Use Case. This can vary for your own system if parameters were customized.

Here you get a short overview of the key figures of your report. You can see how many emails were sent and opened, the opening rate, the number of activated customers and the activation rate.
In the second row you can see how many of your customers have already been contacted or have not yet been contacted. As these are rule-based campaigns, only those customers who once matched a filter of a campaign were addressed. In this example, 64% of the customers have not yet received any communication, e.g., clear sign to extend campaigns to reach more of your customers.
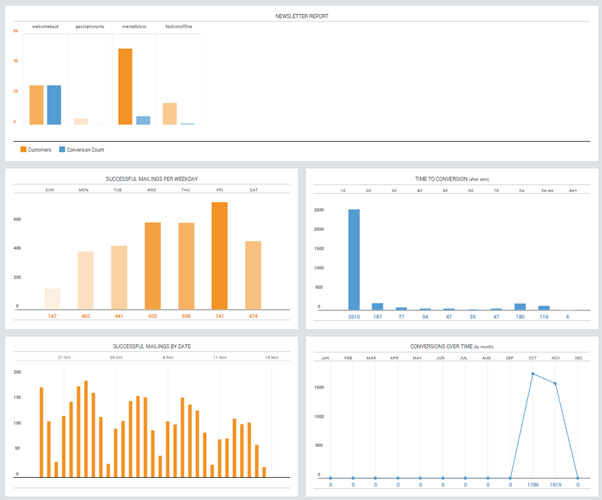
In the lower part of the page, several graphics provide deeper insights into the performance of the campaigns. The filters applied in the upper part also apply to these reports.
- Newsletter report: How many customers were reached and how many conversions were achieved, broken down by campaign.
- Successful mailings per weekday: Conversions over the week (categorized by sent date). In this example, most conversions occurred for E-Mails which were sent on Saturdays. à With this view you can get insights on when to send E-Mails best to maximize conversions
- Time to conversion: how many days after the campaign was sent, the conversions were executed. à With this view you can get a feeling for how long it takes your customers to convert to certain goals.
- Successful mailing per date: Conversions over time, broken down by days (categorized by sent date).
- Conversions over time: Conversions over time broken down by month.
4.2 Campaign Details Report

In the first step, select a time period and a campaign that you would like to evaluate in detail and click on “show data”.
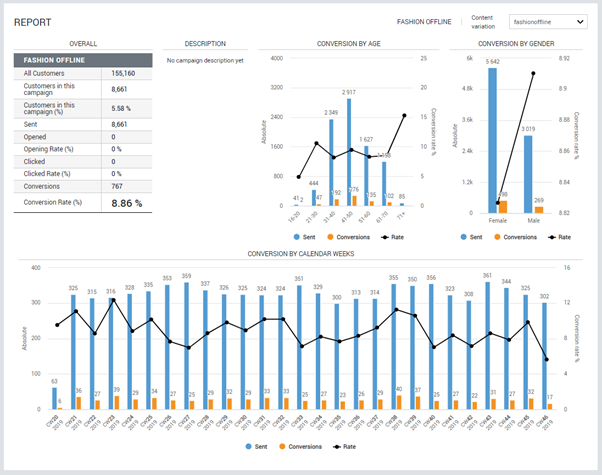
In the first step, you can select a content variation in the upper right part of the page that you would like to examine more closely. All analysis on the page will then refer to this variation.
The upper part of the page gives you detailed insights into the performance of your campaign. The table shows the key performance indicators, such as the number of users, mails sent and conversions. If you added a description when configuring the campaign, you will find it in second place.
The graphs give a deep insight into the conversions by breaking them down by age, gender and calendar week and putting them in relation to the number of emails sent.

Here you can see when which changes were made to the campaign by whom.
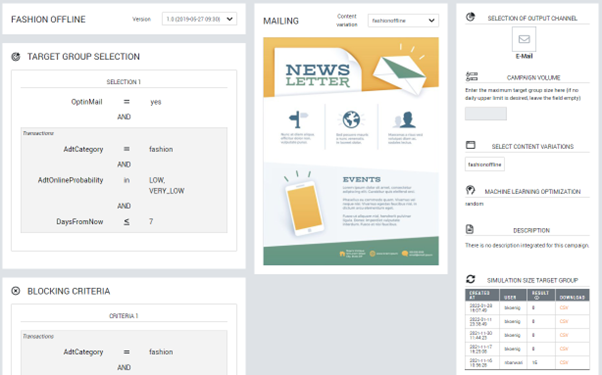
All the settings you have made in the Campaign & Decision Engine (Chapter 6) can be found at the bottom of the page. You can also see what the selected content variation looks like which is often ignored when looking at the numbers in analysis.
4.3 Revenue Report Overview
See the impact of the Adtelligence platform on your revenue at a glance.
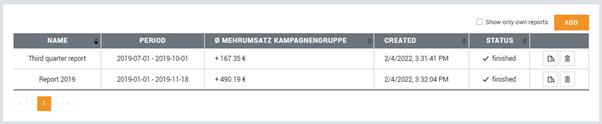
In the upper right part of the table, you will find a box to check. You can use this box to decide whether you want to display all the reports or only the reports you have created.
With a click on the “Add” you can create your own report. Next, give your evaluation a name, select the period to be evaluated and click on the tick to start the analysis.

By clicking on the magnifying glass symbol in the last column of the table, you can access the detailed revenue report for the period you have selected.

To calculate the impact of the Adtlligence platform on total revenue we make use of a global control group. 5% (configurable in the system) of the users are intentionally not served any campaigns apart from the standard communication. For both the control group and the campaign group the average additional revenue per customer is calculated and can be compared. In this way you can clearly measure the impact of the Adtelligence Platform on your total revenue. Example calculation: 167,35 € avg. additional revenue per customer * count of customers (e.g. 500.000) * an average transaction fee of 2% = +1.673.500 € additional revenue (excluded is the additional revenue generated through shifting of customers to revolving credit)
Below you will find a description of the graphics.
- View over all customers
See the impact of the Adtelligence platform on your total revenue - View per age group
See the impact of the Adtelligence platform on your sales based on individual age groups. - View per gender
See the impact of the Adtelligence platform on your revenue based on individual genders.